


On the Speed of Animals, Airborne and Earthbound
Vaclav Smil Explains the Three Categories of Animal Mobility
Animals move in all manner of ways, not all of which fit in the three big categories of mobility: running, flying, swimming. Some organisms are subjected to passive locomotion, carried by water or air (jellyfish, spiders), while many parasites (from ticks to hookworms) ride on or inside other animals. Most aquatic animals swim but some also walk (crabs), jump (like a squirting scallop), and crawl (starfish, sea cucumbers). Flapping flight dominates the airborne movements of flying insects, but birds can also glide and soar. On land, movements range from crawling and slithering (worms, mollusks, arthropods, snakes) to walking and running. Unusual modes of locomotion include lizards running on water, snakes gliding, and apes swinging through trees.
Most daily movements are done in search of food, but eluding predators, searching for mates, and building shelters (termite mounts, birds’ nests, beaver dams) are also important: quotidian animal activities, and for many species annual movements (most notably for birds and some large ungulates), are dominated by long- distance migrations. The cost of transport— the quotient of expended energy used, and the product of body mass and distance traveled (J/kg∙m)— allows us to compare the energy requirements of moving for unrelated species, to get a clear energetic hierarchy of locomotion that is determined primarily by the medium through which the organisms move—that is, by its viscosity and density.
Swimming is metabolically the least expensive (near-neutral buoyancy needs no energy to support bodies), flying costs more, and running is the least efficient mode of animal and human locomotion. All locomotion modes are limited by the metabolic scopes of organisms—the ratio between peak exertion and resting (or basal) metabolic rate. Mammalian scopes are mostly around 10 but go up to 20 for horses and just above 30 for canids. Avian scopes are typically below 20, and so are the scopes for fishes. Maximum speed puts a fundamental constraint on the daily and annual movement of animals—and it would be expected, as with so many other variables, to increase with body mass (M) following a specific power-law relationship (Mb).
But that is not the case, as the largest animals are not the fastest, and the fastest animals (cheetahs, marlins, falcons) are of intermediate size. And animals share two interesting commonalities with airplanes: the biggest animals (elephants, whales), much like the biggest airplanes (wide-body jetliners), move almost constantly, while the fastest animals (predators), much like the fastest airplanes (fighter planes), spend most of their time at rest, and hence their speed average per lifetime is quite low.
If you were to measure speed relative to an animal’s size then insects come out on top.
The most comprehensive analysis of body masses and speeds—including nearly 500 species (mammals, fish, birds, reptiles, mollusks, and arthropods) with body masses ranging from 3 x 10⁻⁸ kilograms to 108,400 kilograms—found that the hump-shaped relationship between mass and speed can best be explained by the fact that maximum acceleration is limited because of restrictions on quickly available energy.
Running and flying animals have an initially similar power-law increase of maximum speed with body mass (v = Mb, speed = mass raised to the power of b) but flying animals are nearly six times faster (exponent b is higher). Swimming animals show a faster speed increase with mass: water is 800 times as dense and 60 times as viscous as air, and a bigger body mass brings a greater benefit in gaining speed. We will look at animal locomotion speeds by following the swimming-flying-running order, but I should also mention some notable exceptions: the energy cost of the submerged swimming of marine mammals is comparable to, or even higher than, running, and the most expensive locomotion is the surface swimming of vertebrates, ducks or people.
Both the typical speeds during extended activities (daily foraging, seasonal migrations) and record speeds during brief rapid hunts and escapes (as predators or prey) range widely, depending on species, the kind of locomotion, and evolutionary adaptations—with ectotherms (cold- blooded animals) being inherently slower than endotherms.
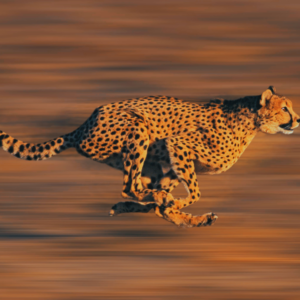
Often-reprinted scales of speed records— topped in the air by peregrine falcons during dives (with claims of top speeds of up to 389 km/h), on land by hunting cheetahs (up to about 100 km/h), and in the ocean by black marlin swimming (more than 130 km/h)— refer to brief (sometimes just a few seconds) and hence exceptional exertions, rather than commonly attainable or average speeds. Moreover, if you were to measure speed relative to an animal’s size then insects come out on top. Paratarsotomus macropalpis, a tiny southern Californian mite, travels 322 of its body lengths in a second, compared to just 16 body lengths for a cheetah.
The size (body length) of swimming organisms spans seven orders of magnitude, from a few micrometers to several tens of meters. As just noted, their average speed increases with size faster than with runners or flyers, and among macroscopic species the fastest speeds are attained by vertebrates using lift- based, lateral, or caudal (fins or tails) propulsion. Fresh water density is 1,000 kg/m3 (with only slight temperature changes), while seawater weighs 1,026 kg/ m3—but densities of aquatic organisms are higher and adaptations are needed to achieve buoyancy. Most ray-finned fishes, the largest group of living vertebrates, have gas-filled swim bladders; some cephalopods have gas-filled chambers inside shells; many squids contain ammonium-rich body fluids; some sharks come close to seawater’s density thanks to having large amounts of squalene (a colorless oil) in their livers, but others (and tunas) support their slightly higher densities by lift on their pectoral fins.
Fish swim by alternate contractions of aerobic muscles that run the length of their bodies in a small red band just under their skin, while their large white anaerobic muscles are used only for brief bursts. There are, of course, large speed differences among typical swimming modes. For example, in laboratory experiments Atlantic mackerel average less than 0.3 m/s when swimming during the night, 1 m/s during prey capture, and their free- swimming burst speeds are up to about 3 m/s. But there are notable exceptions to this dominant locomotion arrangement: such powerful swimmers as tunas and white sharks have red aerobic muscles deep inside their bodies as well—and, moreover, constant contractions keep those internal muscles significantly (10–20°C) warmer than the surrounding ocean, making them ready either for fast evasion when threatened or for a swift attack.
Published studies put the estimated maximum speed of swimming at about 35 m/s (126 km/h) for sailfish and black marlin, with the great white shark (at 40 km/h) being significantly slower than orcas (55 km/h), while a blue whale reaches no more than 37 km/h. But the fastest swimming speed claims are almost certainly indefensible exaggerations. Perhaps the most fundamental approach to estimating the maximum speed potentially attainable by a fish is to measure its minimum muscle contraction times: after all, fish swimming speeds are limited by tail-beat frequency and minimum muscle contraction times that set theoretical speed maxima. Measurements of the twitch contraction time of anaerobic swimming muscles for sailfish lead to a maximum estimated speed of 8.3 m/s (29.88 km/h), while three other large marine pelagic (open-sea) predatory species—barracuda, little tunny, and dorado (mahi mahi)—have estimated maxima of, respectively, 6.2 m/s, 5.6 m/s, and 4.0 m/s.
This suggests that billfishes, and other fishes using lunate (pointed but not sharply forked) tails for propulsion, cannot exceed swimming speeds of 10–15 m/s, a conclusion reached previously based on three hydrodynamic considerations: the maximal power producible by fish muscles, the limit on the maximal tail-beat frequency, and the onset of cavitation (the formation of bubbles on fish fins and tails that can be painful at high speeds). Cavitation also limits the speed of modern metal ship propellers powered by large internal combustion engines.
In any case, the fastest airspeeds are not reached in flapping or gliding flight but in dives by birds of prey.
Moreover, a study that used acoustic telemetry to collect 175 hours of continuous swimming speed data of three blue marlins (with body mass up to 125 kilograms) showed that they spent most of their time swimming very slowly, just 15– 25 cm/s (less than 1 km/h) when near the surface, with very brief speed increases associated with deep dives. And just one more speed range, for the most telegenic of all whales: years of electronic theodolite observations of free-swimming killer whales (orcas) in a British Columbia strait showed rather narrow ranges of speeds: minima of 2. 2–2.5 km/h, means of 5–6.1 km/h, and maxima of 7. 5–10.8 km/h.
Specific energy requirements for flight are determined by the ratio between drag (D) and lift (L), the measure of aerodynamic quality. D/L ratios are around 0.2 for small birds, only 0.07 for seagulls, and at 0.05 albatrosses can do better than jetliners! The reverse value (L/D) is known in English as the glide ratio; in French it has a more evocative term, finesse (F). Flying with high finesse saves energy and allows for admirably long gliding.
This mode of flying requires no active muscle power, as it converts potential energy to kinetic energy, and it is common among such large birds as albatrosses, condors, eagles, frigatebirds, storks, and vultures. The best gliders, with long slender wings and highly streamlined narrow bodies, have F of 60, losing just 1 meter of altitude for every 60 meters of horizontal progress: from a height of 5 kilometers, they could fly another 300 kilometers before landing!
And even the bulky-looking jumbo Boeing 747 has F = 15, which means that if all its four engines fail (a most unlikely possibility), at its cruising altitude of 10 kilometers above sea level it could glide for 150 kilometers to make it to the nearest airport.
Aerodynamic theory predicts that gliding airspeed should scale with bird size and wing shape, but radar tracks of more than 1,300 birds from 12 species did not confirm those relationships, and found instead that average gliding speed unexpectedly converges to a narrow range of about 12.6–15.4 m/s. The best explanation of this discrepancy is that gliding birds adjust their speed to minimize the risk of grounding or switching to a more costly flapping flight. Soaring birds fly without flapping wings, using rising air currents to uplift them. Most seabirds, including the already noted gliders as well as seagulls, pelicans, and terns, are accomplished practitioners of soaring, as are most birds of prey, cranes, herons, and some passerine species (choughs, ravens, wood swallows).
Despite substantial differences in total body mass, wingspan, and finesse, two studies based on radar measurements of nearly 140 species of migrating birds whose body mass ranged from tiny passerines (10 grams) to swans (10 kilograms) showed that their airspeeds did not scale as steeply with higher body mass and wing loading as predicted by aerodynamic theory. The first study found that migration speeds for most bird species range between 10 and 15 m/s, with mallards, pigeons, and crows being among a relatively small number of species averaging speeds near or above 20 m/s, while speeds below 10 m/s are rather common among such small birds as pipits, redstarts, wagtails, and warblers.
Similarly, the second study found a relatively small range of migration speeds (8– 23 m/s), and its authors suggested that some notable evolutionary restrictions work to counteract too-slow and too-fast speeds among, respectively, birds with low and high wing loading (body weight divided by wing area). For comparison, honeybees, those indefatigable insect flyers gathering nectar and pollen, move with speeds mostly between 1 m/s and 2 m/s.
Not surprisingly, migration flights (some longer than 13,000 kilometers in one direction) proceed at optimal speeds that are much lower than brief maximum speeds, with record speed claims (of uneven veracity) going as high as nearly 90 km/h for swans, about 90 km/h for swifts, 127 km/h for the wandering albatross, and 153 km/h for the ascension frigatebird. And while common swifts may not be the fastest fliers, new research (equipping them with micro data loggers and accelerometers) has shown that they are unsurpassed endurance fliers, remaining airborne for more than 99 percent of the time during the 10-month non-breeding period they spend migrating between Europe and sub-Saharan Africa, surpassing the endurance of other exceptional long-distance migrants including Arctic terns and great frigatebirds.
Once again, speed as a function of mass has a hump-shaped progress.
In any case, the fastest airspeeds are not reached in flapping or gliding flight but in dives by birds of prey. High-resolution videogrammetry shows how these raptors change their wing shape in attack, holding their wings depressed below their shoulder and reducing the curvature with increased speed. Falcons begin their attacks hundreds of meters above their prey, and accelerate by beating their wings before folding them and diving, with angles ranging from about 15° from horizontal to a nearly vertical direction—turning potential into kinetic energy and reaching top speeds that were estimated by observers to range up to 157 m/s, briefly equivalent to about half of the speed of sound!
But these claims were disputed, especially as radar measurements show much lower velocities. Thanks to small GPS data loggers, we now have reliable measurements of diving speeds for five African hunting falconry birds: the devices weighed just 1.5– 2.5 percent of the birds’ body weight and hence had a minimal effect on their performance. There was a strong positive correlation between maximum hunt speed and maximum flight height for the long-wing species, while maximum and mean flight speeds were negatively correlated with wing area for all five species studied. A female peregrine falcon reached the highest speed of 195.97 km/h during 20-second flight, with a mean speed of nearly 128 km/h, and her maximum acceleration was about 12 m/s2.
Running is the form of locomotion that is practiced by organisms ranging in body mass from tiny arthropods (millipedes, arachnids, insects) and small-size reptiles (geckos) to large birds (ostriches, rheas, cassowaries) and to mammals of all sizes, from the smallest mice to the largest megaherbivores—rhinos, hippos, and elephants. Running is the fastest terrestrial gait, following walking, trotting, and galloping. Each of these gaits has a different footfall pattern and duty factor—that is, the fraction of a cycle for which a given foot is in contact with the ground. Running has a duty factor of less than 0.5, but fast-moving elephants, whose duty factor is as low as 0.37, are not really running because they always keep at least one foot in ground contact.
The number of steps per unit of distance is inversely proportional to body length (smaller creatures must take many more steps to cover the same distance), while the work accomplished for each step is proportional to body mass. As an animal gets larger, its available power goes up faster than the cost of running—allowing large mammals to run much faster (up to an order of magnitude more) than the smallest ones. Moreover, large mammals reuse significant shares of energy spent running, because a part of the kinetic and potential energy deployed to run is temporarily stored as elastic strain in muscles and tendons and redeployed as elastic recoil.
Once again, speed as a function of mass has a hump-shaped progress. An analysis of body masses and maximal running speeds for 100 terrestrial mammals—with typical adult body masses ranging from more than 6,000 kilograms to 16 grams (African elephant to mouse)—found the optimal size for running to be about 120 kilograms, about the size of a mule deer. Up to that point, for all runners (arthropods, birds, reptiles, and mammals), larger mass is associated with higher speed—but, as with fishes and birds, the largest running animals are not the fastest, and for artiodactyls (even-toed ungulates), carnivores, and rodents the maximal running speed is mass-independent. Still, some of the largest mammals, including some megaherbivores whose mass exceeds 1,000 kilograms, are surprisingly fast. Massive, lumpy-looking hippos, who prefer to wallow or swim slowly in water pools, lakes, and rivers can run as fast as 25 km/h (about 70 meters in 10 seconds), a respectable sprinting speed not to be matched by most adults trying to outrun an enraged animal.
Fast speeds are necessary to escape predators, but often the fastest attainable speed is not the best option—or as one recent study (of Australia’s northern quolls, small cat-like carnivorous marsupials) rightly puts it in its title: running faster causes disaster. As expected, a higher escape speed increases the probability of crashes when rounding corners or when escaping along a tree branch. Among predators, mass enhances speed up to about 70 kilograms of body mass, but it diminishes turn capacity: swift predators can outrun their prey, but they may not be able to outmaneuver it. This is an important consideration for all terrestrial pursuit predators: larger animals have greater turn radii and hence they must adjust their pursuit speed to match the cornering ability of their prey.
Cheetah hunts nearly always involve not just a pursuit but also a series of evasions, and hence hunting dynamics are greatly influenced by the behavior of differently sized prey.
Decades of African wildlife TV broadcasts have made most people aware of the extraordinarily fast sprints of savannah antelopes, but few would correctly name the fastest species of that family: the common tsessebe (Damaliscus lunatus) can surpass 90 km/h; springbok come close (88 km/h), and black wildebeest, Thomson’s gazelle, impala, and Grant’s gazelle can reach 80 km/h. But most people know that a single cheetah can eventually get even the fastest antelope. Is Acinonyx jubatus really the fastest animal sprinter? We now have plenty of accurate evidence to assess this claim and to cite irrefutable records rather than dubious estimates.
Obviously, the fastest speeds are attained only fleetingly, during the opening and middle phases of a cheetah’s hunting run, which lasts typically less than 20 seconds and rarely longer than 30 seconds, but for decades the only measurements of the cheetah’s running speed were done with captive (or semi- tame) animals chasing a lure on a straight course or by analyzing filmed hunts in open habitats during daylight. The published top speeds of up to 29.8 m/s (or 107.3 km/h) were significantly faster than those of greyhounds bred for speed and high pulmonary capacity. A detailed comparison of the musculoskeletal anatomy of cheetah and greyhound limbs explains why greyhounds can do no more than 17 m/s.
These animals are of similar size and of similar gross shape—and, surprisingly, cheetahs have a smaller volume of hip extensor musculature than greyhounds. But they use their extensive back muscles to accelerate, their hindlimb bones are proportionally longer and heavier (making longer strides possible), and their extremely powerful psoas muscle (in the lower lumbar region of the spine, extending through the pelvis to the femur) helps to resist the pitching around the hip that associated with fast accelerations. No less important is the fact that a cheetah supports 70 percent of its body weight on its hindlimbs when running at 18 m/s, and a greyhound just 62 percent of its body weight. Supporting a higher share of body weight on those limbs reduces the risk of slipping.
Finally, cheetahs also have higher stride frequency (up to four cycles a second) than greyhounds (about 3.5). But heat dissipation limits the exertion: when sprinting at close to 100 km/h, a cheetah’s heat production would be more than 60 times greater than at rest, and as most heat (70–90 percent) is stored rather than immediately dissipated, the maximum pursuit distance will be limited by this as the animal comes close to overheating. At rest the animals dissipate heat efficiently (maintaining a constant body temperature of about 40°C, even when the air temperature is 10 degrees higher), but this evaporative heat loss is not enhanced during fast runs. The high energy cost of these exertions is well illustrated by comparing breath frequencies: 16 breaths/min at rest, up to 156 breaths/min after a dash. Obviously, the need for subsequent rest and recovery limits the frequency of such chases.
By far the best evidence of the cheetah’s hunting behavior comes from monitoring nearly 400 runs of five radio-collared wild cheetahs in Botswana, equipped with GPS, accelerometers, and other devices to provide highly accurate information about their position, direction, speed, and movement. The fastest run was 25.9 m/s (93.2 km/h), but the average run was only 173 meters (the longest one 559 meters) and the mean top speed of all runs was only 14.9 m/s.
At the latter speed the animal’s turning radius would be 52 meters, and a 180-degree turn would take six seconds complete, far too long and much too slow to be of any use in capturing a quick-turning prey. Consequently, most hunting runs proceed only at moderate speeds, and the animals can slow by 4 m/s in a single stride to make tight turns, using their tail for balancing and their ridged footpads and claws to maintain good grip, and hence they can successfully hunt not only in open grasslands but also in densely wooded areas.
Cheetah hunts nearly always involve not just a pursuit but also a series of evasions, and hence hunting dynamics are greatly influenced by the behavior of differently sized prey. A cheetah will first accelerate (up to 7.5 m/s2) to close on its prey (achieving hunting speeds close to 19 m/s), and then reduce its speed to make it easier to execute the rapid turns required to match prey escape tactics: as the team who used GPS and tracking collars to study cheetah hunting runs concluded, “Predator and prey thus pit a fine balance of speed against manoeuvring capability in a race for survival.” This has been confirmed in a more general manner by simulations of predator-prey encounters: escape success is determined by both speed and maneuverability, and hence a highly maneuverable slow prey can still escape predation while a poorly maneuverable prey can escape only when outrunning its predators.
__________________________________
From Speed: How It Explains the World. Used with the permission of the publisher, Penguin Books. Copyright © 2026 by Vaclav Smil
Vaclav Smil
Vaclav Smil is Distinguished Professor Emeritus at the University of Manitoba. He is the author of over forty books on topics including energy, environmental and population change, food production and nutrition, technical innovation, risk assessment, and public policy. No other living scientist has had more books (on a wide variety of topics) reviewed in Nature. A Fellow of the Royal Society of Canada, in 2010 he was named by Foreign Policy as one of the Top 100 Global Thinkers.