


Flukes, Fakes and Statistical Uncertainties: What Happens When Physicists Fail
Harry Cliff on the Slippery Nature of Probability in the Pursuit of Scientific Discovery
In December 2015, just as the Large Hadron Collider powered down for its scheduled winter break, the ATLAS and CMS collaborations, the international teams that operate two of the collider’s giant detectors, presented an intriguing pair of results. After scouring trillions upon trillions of high-energy proton smashups, they had each noticed a tantalizing bump in a graph.
Now, there is nothing that gets particle physicists more hot and bothered than a bump in a graph. Such deviations often presage the discovery of a new particle. In this case the putative new particle was a whopper, weighing in at 750 GeV, or around six times the mass of the Higgs boson, a particle whose recent discovery had made headlines around the world.
At the time, a drought of discoveries since the Higgs had begun to make many fear that the Large Hadron Collider—constructed at enormous cost and bearing outsides expectations—might yield only a subatomic desert. And so the first hints of a new particle were extremely welcome indeed.
Within just a few weeks of the presentation, more than five hundred papers had been penned by theorists attempting to explain the bump in terms of this or that theory. A Common proposal suggested it was the first member of a whole zoo of super-particles predicted by the grand theoretical paradigm known as supersymmetry. If that were true, then we were at the start of the biggest breakthrough in fundamental physics since the 1980s (or March of the previous year, if you count the discredited BICEP2 result).
In any case, lots of physicists were very excited indeed, and the excitement reached fever pitch at the International Conference on High Energy Physics, held in Chicago in August 2016. Both the ATLAS and the CMS teams were scheduled to present new studies of the bump, adding additional data recorded that year, promising to turn their tentative hint into a full-blown discovery.
But to the dismay of many in the community, when they revealed their crucial graph, the bump was nowhere to be seen. With more data it had simply melted away. The oasis in the desert had proved to be nothing more than a mirage.
So, what had gone wrong? Had the experimenters ballsed things up? Was there something wrong with the detectors?
Openness to criticism is essential if you really want to discover something new about nature.
Well, actually, no, nothing had gone wrong. When ATLAS and CMS presented their results in December, they had been careful to state that the statistical significance of their result was far below the threshold required to declare a true discovery. Unlike the BICEP2 team, they had made no grand claims. They had merely presented the results as they were. If anyone was to blame, it was theoretical physicists, the overexcitable little dears, who were so desperate for signs of something new that they were prepared to jump on any bump, no matter how insubstantial.
The bump, it turned out, had been nothing more than a cruel statistical fluke—a wobble in the data of the kind that happens from time to time, purely by chance. Understanding the whole issue of statistical significance is critical to our story of anomalies, and this particular episode is a great way to get our heads around how and why statistics can occasionally fool us if we don’t have our guard up.
The first thing to understand is that all measurements come with “uncertainties” or “errors,” two words often used interchangeably. The uncertainly on a measurement is an expression of the precision with which we think we have measured a particular quantity. Uncertainties come in two key types. There are statistical uncertainties and systematic uncertainties.
Let’s start with statistical uncertainty. To draw on the classic example, imagine I gave you a coin and asked you to determine if that coin is fair, or to put it more formally, if the probability of that coin coming up heads or tails is equal. To test this, you toss the coin twice and get one head and one tail. On the face of it, this might suggest that the coin is fair.
But you probably have the feeling that we can’t really be sure from only two tosses. Indeed, like all measurements, this one comes with an uncertainty, and with only two coin tosses this uncertainly is large. I’ll spare you the math and tell you that it’s around 26 percent. We might therefore express our measurement of the probability of getting a head in this situation as
p(heads) = 50% ± 26%
What does this mean? Well, according to the standard statistical definition of uncertainty, this means that there is around a 68 percent chance that the true probability of the coin coming up heads lies within one uncertainty of our measured value. Or put another way, we can say with 68 percent confidence that the probability of getting a head is between 24 percent and 76 percent. Our two throes haven’t given us enough data to say whether our coin is fair or not. We need more evidence.
So now let’s imagine you toss the coin a hundred times and get fifty-two heads and forty-eight tails. In this case, your measurement would be expressed as
p(heads) = 52% ± 6%
Because you have added more data, the size of the uncertainty has shrunk. Now you can say that there is a 68 percent chance that the probability of our coin coming up heads lies between 46 percent and 58 percent. This is consistent with it being a fair coin, although there’s still a reasonably large range. This is a key characteristic of statistical uncertainties: they get smaller with more data. Now let’s imagine you really went to town and tossed the coin 10,000 times, getting 5,301 heads and 4,699 tails. Now things get interesting:
p(heads) = 53.0% ± 0.9%
Your measured value is now more than three times the uncertainty away from 50 percent. In statistics, uncertainty is referred to by the Greek letter sigma, and here we have what’s known as a three-sigma result, hinting that the coin may in fact be biased. It means that statistically, there is less than a one-in-a-thousand chance that you would get a result this far from evens—5,301 heads, 4,699 tails—from a fair coin.
As it happens, this was roughly the statistical precision of the bumps seen at the LHC in 2015. In both cases, the wobbles in the two graphs were just over three uncertainties way from the number of particles you would expect from random background processes. This meant that, in practical terms, there was only a one-in-a-thousand chance of the data randomly wobbling up in a way that would give the illusion of a new particle.
On the face of it, three-sigma evidence might sound pretty convincing: a 999-in-1,000 chance of having discovered something new is pretty good odds, right?
Okay, but now imagine that I told you that you were only one of a thousand people I had given a coin to, and that they had all done similar experiments, and you were the only one who had gotten a result that crossed the three-sigma threshold. Knowing that you were only one of a large number of measurements. Might make you wonder whether you just got your result by dumb luck. In other words, the coin really was fair, but just by random chance it came up with more heads than you might naively expect.
This, too, is more or less what happened at the LHC in 2015. Collider experiments don’t just search for one type of particle in one way; they make literally thousands of measurements and searches. This means that over time you should expect a few of these to give you three-sigma fluctuations, just by chance. This is why no good particle physicist trusts a three-sigma result. The gold standard to declare a discovery is five uncertainties, or “five sigma,” from your theoretical expectation. At that level, there is less than a 1-in-1.7 million chance of the result being a statistical fluke. And while we make thousands of measurements at the LHC, we certainly don’t make millions.
Let’s revisit the coin example one more time. Now that there’s three-sigma evidence that the coin is biased, a load of theorists have gotten very excited and you have been given a large grant to support a hugely ambitious experiment to toss the coin more than 10 million times. Of course, now you’re a tenured professor and you don’t have time for such grunt work, so you hand the task to your underpaid team of PhD students and postdocs. After more than a year of round-the-clock tossing, you are finally ready to present your team’s result to the world: 5,003, 421 heads and 4,996,579 tails, giving
p(heads) = 50.03% ± 0.04%
Because you have added more data, the uncertainty has shrunk and your three-sigma anomaly has vanished. The coin really is fair, to within a precision of just 0.04 percent. The original three-sigma result was just a fluke, nothing more. Alas, no Nobel Prize for you. You have been fooled by statistics.
This kind of thing happens in science all the time. It is especially common when you are dealing with limited data sets. The solution, in every case, is to take as much data as you can and try not to get overexcited when you see a three-sigma result. In particle physics we have a rather arbitrary standard by which we judge results like this: three sigma is regarded as “evidence”—that is the point at which it’s worth paying attention to an effect, but long before you think about booking a ticket to Stockholm. Meanwhile, five sigma is an “observation” or “discovery.” This five-sigma gold standard is there to protect us against being fooled by statistics.
Here’s a trusty scale I’ve invented to help think about an anomaly and its level of disagreement with prevailing theory:
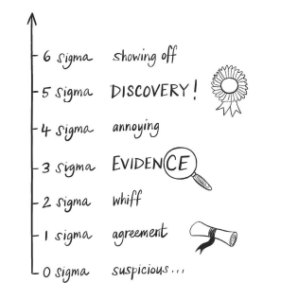
As I said, these sorts of statistical flukes are straightforward to deal with; they always get found out I the end. However, there are other types of errors that can be much harder to untangle.
*
In July 2014, I traveled to sunny Valencia, Spain, to attend the biggest particle physics event of the year, the International Conference on High Energy Physics. After growing somewhat bored listening to report after report on the failure (so far) to find any signs of new particles at the Large Hadron Collider, I deiced to wander into the astroparticle physics section to see what might be going on. I was rewarded with one of the most ferocious and entertaining scientific arguments I’ve ever witnessed, the physics equivalent of a no-holds-barred wrestling match, only without any actual physical contact.
This rather forceful exchange had been triggered by a presentation form the team behind an experiment buried inside the Gran Sasso mountain in central Italy, who for several years had been making a highly controversial claim: that they had discovered the first direct evidence for dark matter.
As we’ve seen, dark matter dominates the physical universe. Five times more abundant than the ordinary matter that makes up galaxies, stars, and you and me, its gravity binds the universe together and was crucial in the formation of structure after the big bang. However, despite a wealth of astronomical evidence that it exists, we have no idea what it’s made from. Detecting dark matter particles directly is therefore one of the great missions of modern physics.
So, any experiment claiming to have spied dark matter particles was inevitably going to attract a lot of scrutiny. Known as DAMA/LIBRA, the experiment in question had been designed to search for these particles using crystals of sodium and iodine. The idea was that as the Earth plows through the invisible cloud of dark matter that engulfs out galaxy, occasionally a dark. Matter particle would bump into an atom in one of the crystals, producing a flicker of light. Since 1998, the team had been reporting just such signals, and what’s more they had found overwhelming evidence of what is regarded as the smoking gun of dark matter detection: a signal that rises and falls with the seasons.
Why should the seasons have anything to do with dark matter? Well, the Sun is currently orbiting the Milky Way at 828,000 kilometers per hour, and while the galaxy is rotating, its associated dark matter cloud is stationary. This should create an 828,000 kilometer-per-hour dark matter wind blowing continuously through the solar system.
Meanwhile, the Earth is orbiting the Sun at 107,000 kilometers per hour. On around June 2 every year the Earth’s motion around the Sun is most aligned with the Sun’s motion around the galaxy, creating a particularly strong dark matter headwind. Six months later, in early December, the Earth is moving in the opposite direction to the Sun’s orbit, and so experiences a slightly gentler dark matter breeze. Just as your front gets wetter quicker when running into the wind during a rainstorm, you’d expect to get hit by more dark matter when you’re moving into the wind than when you’re going in the opposite direction. So, if you see a rate of dark matter interactions that rises and falls with the seasons, that’s a clear indication that you’re seeing genuine dark matter particles.
Not only had the team behind DAMA/LIBRA been reporting a seasonal signal since 1998, but their signal also peaked in June, the exact time that the Earth is moving fastest with respect to the unseen dark matter cloud. On the face of it, it looked like a slam-dunk discovery. However, a number of subsequent experiments that should have been sensitive to the same dark matter particles had since come up empty-handed.
Mistakes in science are inevitable. The important thing is to remain humble enough to admit when you’ve made one.
After the presentation conclude, a member of the audience got up to ask why DAMA/LIBRA refused to make their data public so others could cross-check their results. The speaker responded that it was their proprietary data and in any case nonexperts wouldn’t be able to make sense of it without a detailed understanding of the experiment. This left the questioner, and many others in the room, rather unsatisfied to say the last, leading to a heated exchange that was eventually brought to an end by the session chair.
A decade later, very few scientists outside the DAMA/LIBRA team take their result seriously. A range of far more sensitive experiments have all but ruled out their claimed signal, including tow experiments that essentially replicated their setup in other laboratories. However, the DAMA/LIBRA team remains defiant: as far as they are concerned, their result stands; it’s the other experiments that have messed up their measurements.
So, what could have gone wrong with DAMA/LIBRA? Well, on the face of it, it looks like a classic example of the second key type of uncertainty—a systematic error. A systematic error is an effect that can bias the result of an experiment, or even completely spoof a signal. Dealing with such systematic errors is arguably the most important and difficult job of an experimental physicist; it is only by questioning every part of your experiment and analysis procedure that you build confidence in the final result—a statement that is all the truer when claiming a major discovery. However, finding systematic errors can be an extremely difficult task. Even the best scientists can miss effects simply because they never thought of them, or because of a flaw in how an effect is estimated.
One notorious case is that of the OPERA, a particle detector housed in the same subterranean lab inside the Gran Sasso mountain. OPERA studied neutrinos, particles famed for their ability to pass through even the densest material. For the purposes of their study, a bean of neutrinos was created by a particle accelerator at CERN, near Geneva, then fired under the Alps and down the length of Italy to Gran Sasso, where it was measured by OPERA’s detector. In 2011, they reported that these neutrinos appear to have traveled through the Earth faster than the speed of light.
The speed of light is an unbreakable speed limit according to Einstein’s theory of relativity, so the consequences of such a discovery, if true, would be profound. To be fair to the OPERA team, when they presented their results, they directly invited other scientists to point out the mistakes in their measurement. They made no grand claims that they had proven Einstein wrong.
Nevertheless, when the issue was eventually traced to a cable that hadn’t been plugged in properly, the team operating the experiment faced ridicule in some quarters, rather unfairly, in my view. These experiments are incredibly complex, and it’s always possible to miss something despite your best efforts, particularly when you have a shed load of cables to check.
But what about DAMA/LIBRA? How to explain the fact that they had allegedly seen a clear annual signal, year after year after year? A potential answer came from an independent team of Italian physicists in 2020, who noticed that DAMA/LIBRA as doing something rather dangerous when analyzing their data.
One of the biggest challenges of dark matter experiments is beating down background noise from natural radioactivity, which can easily swamp a faint dark matter signal, like a loud vacuum cleaner making listening to the telly nigh on impossible. Experimenters therefore go to extreme lengths to eliminate all sources of radioactive contamination.
But even after creating as radiation-free an environment as possible, there will always be some residual background that you can’t get rid of. The trick then is to accurately estimate this leftover radioactivity and take it into account when you make your measurement. The way DAMA/LIBRA dealt with this was to take an average of the background radiation rate over the course of a year and then subtract it from their measured dark matter signal every September.
However, doing something to your data once per year is a terrible idea when you are trying to measure a signal with an annual cycle. In essence, the DAMA/LIBRA team risked injecting an artificial yearly wobble into their data, which under the right circumstances could make you think you’d discovered dark matter.
Nicola Rossi, a physicist independent of DAMA/LIBRA, was part of a four-person team who first suggested this risky procedure might be the cause of the claimed dark matter discovery. Their aim, he later told me, was to encourage DAMA/LIBRA to reveal a key bit of information that would allow the outside world to check whether this effect could be at the root of the mystery. So far at least, the experimental team hasn’t taken them up on their challenge.
“They are good physicists, individually,” he said. In the early days, the DAMA/LIBRA team members were pioneers of dark matter detection, and their early results were generally believed. “The problem is when they come together, you get groupthink,” Rossi offered. Now they struggle to get published in mainstream journals.
More recently, an experiment in Korea called COSINE-100 that uses the same detection technology applied DAMA/LIBRA’s method for dealing with background radiation, and they found that it did indeed induce an artificial annual signal—the kind the Italian team claimed was evidence of dark matter. So, from the outside at least, it looks as though systematic error were to blame for DAMA/LIBRA’s finding. However, until DAMA/LIBRA is prepared to reveal the key bits of data, we can only speculate. (I approached members of the DAMA/LIBRA team to talk about the anomaly but was met with a wall of silence.)
If there’s a lesson in this, it is about humility. The OPERA team checked and checked their result for an explanation, and when they couldn’t find one, they put it out into the world and invited people to help them find their mistake. Such openness to criticism is essential if you really want to discover something new about nature. Hoarding your data and sticking to your guns in the face of criticism—that, on the other hand, is a recipe for distrust and doubt.
Mistakes in science are inevitable. The important thing is to remain humble enough to admit when you’ve made one.
With these cautionary words still ringing in our ears, it’s time to dive headlong into the anomalies of today—the findings threatening to reshape our understandings of the cosmos. Where better to start than at the bottom of the Earth.
__________________________________
From Space Oddities: The Mysterious Anomalies Challenging Our Understanding of the Universe by Harry Cliff. Reprinted by permission of Doubleday, an imprint of the Knopf Doubleday Publishing Group, a division of Penguin Random House LLC. Copyright © 2024 by Harry Cliff.
Harry Cliff
Harry Cliff is a particle physicist based at the University of Cambridge and carries out research with the LHCb experiment at CERN’s Large Hadron Collider. He was a curator at the Science Museum, London for seven years and regularly gives public lectures and makes TV and radio appearances. His 2015 TED talk “Have We Reached the End of Physics?” has been viewed nearly 3 million times.